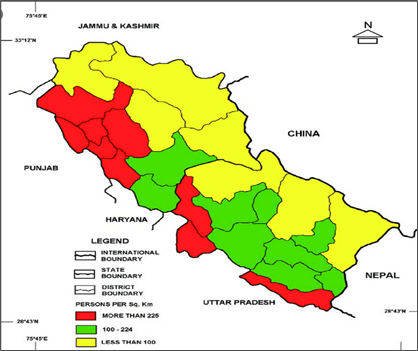
Find your area and exposure score you are in:
If >225 then the score is high=5 if your area is between 100-224 medium=4 if less than 100=3

Divide the scores that you obtained into 3 separate classes. Let’s say group came up with the scores for several places. If more than average Risk score then High, if it is around average=M if it is much lesser than average=Low (ideally it is done by using 1 times standard deviation from average as medium and 2 times standard deviation from average either more or less as high and low).